FR
Grant users the power to build custom reports tailored to their specific needs
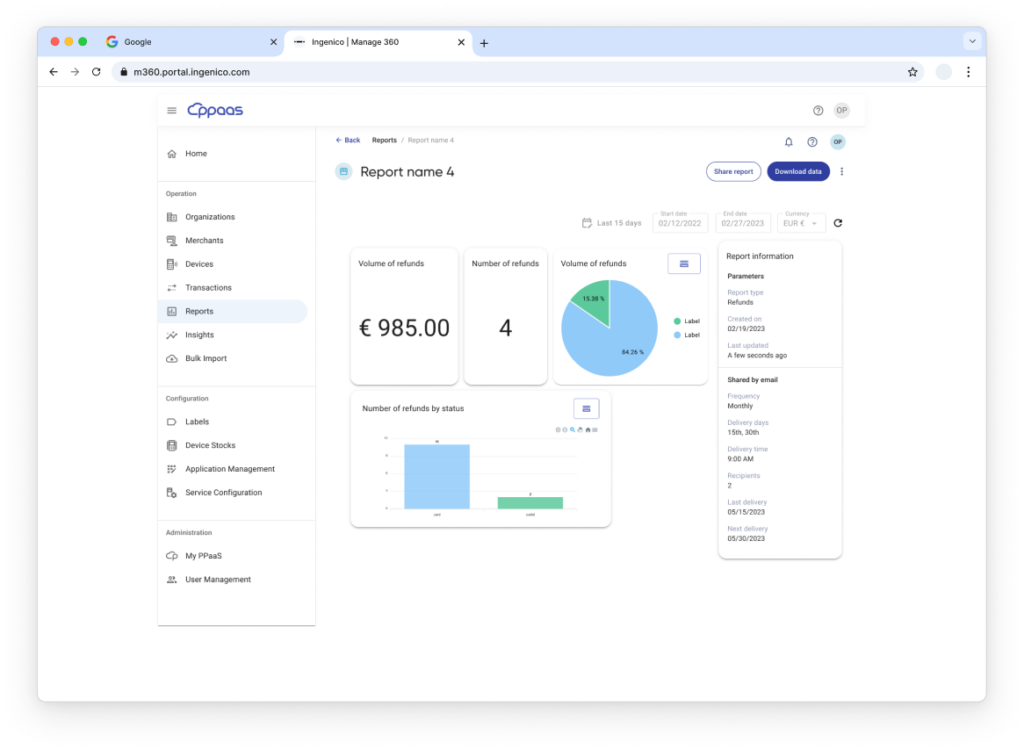
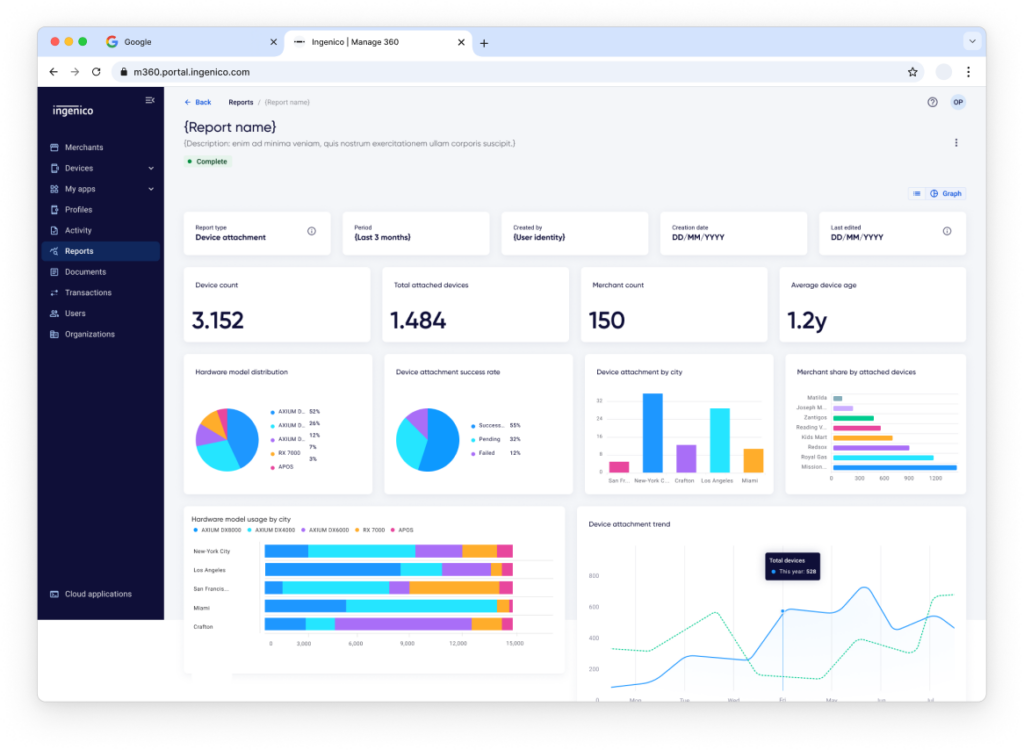
Report details (tablet)
Role
Lead Product Designer
Duration
36 months
Team
Before
After
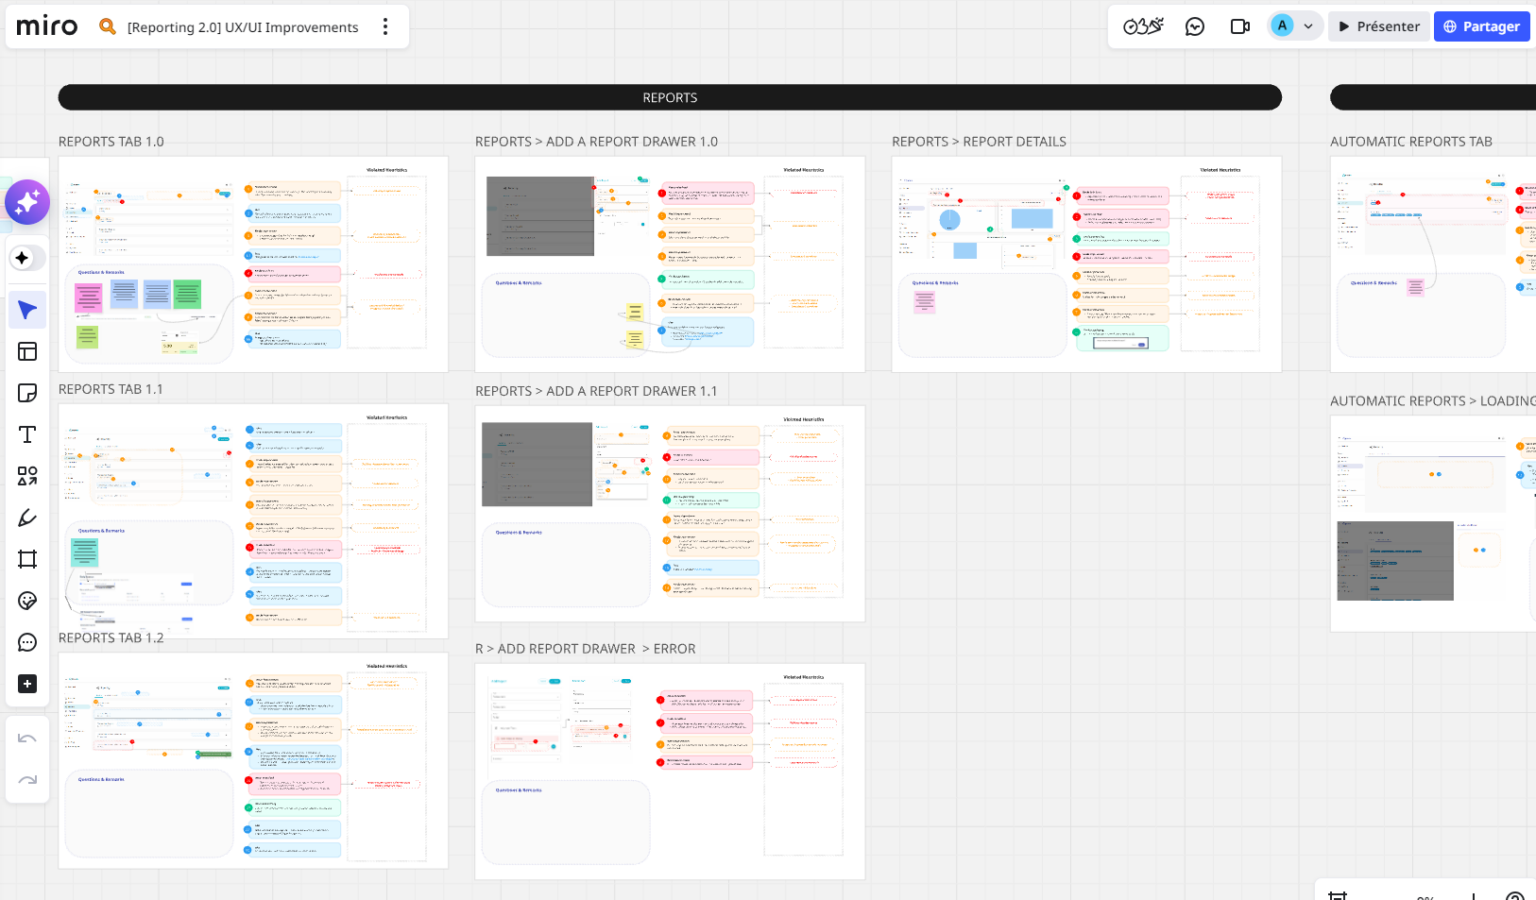
Approach
UX audit
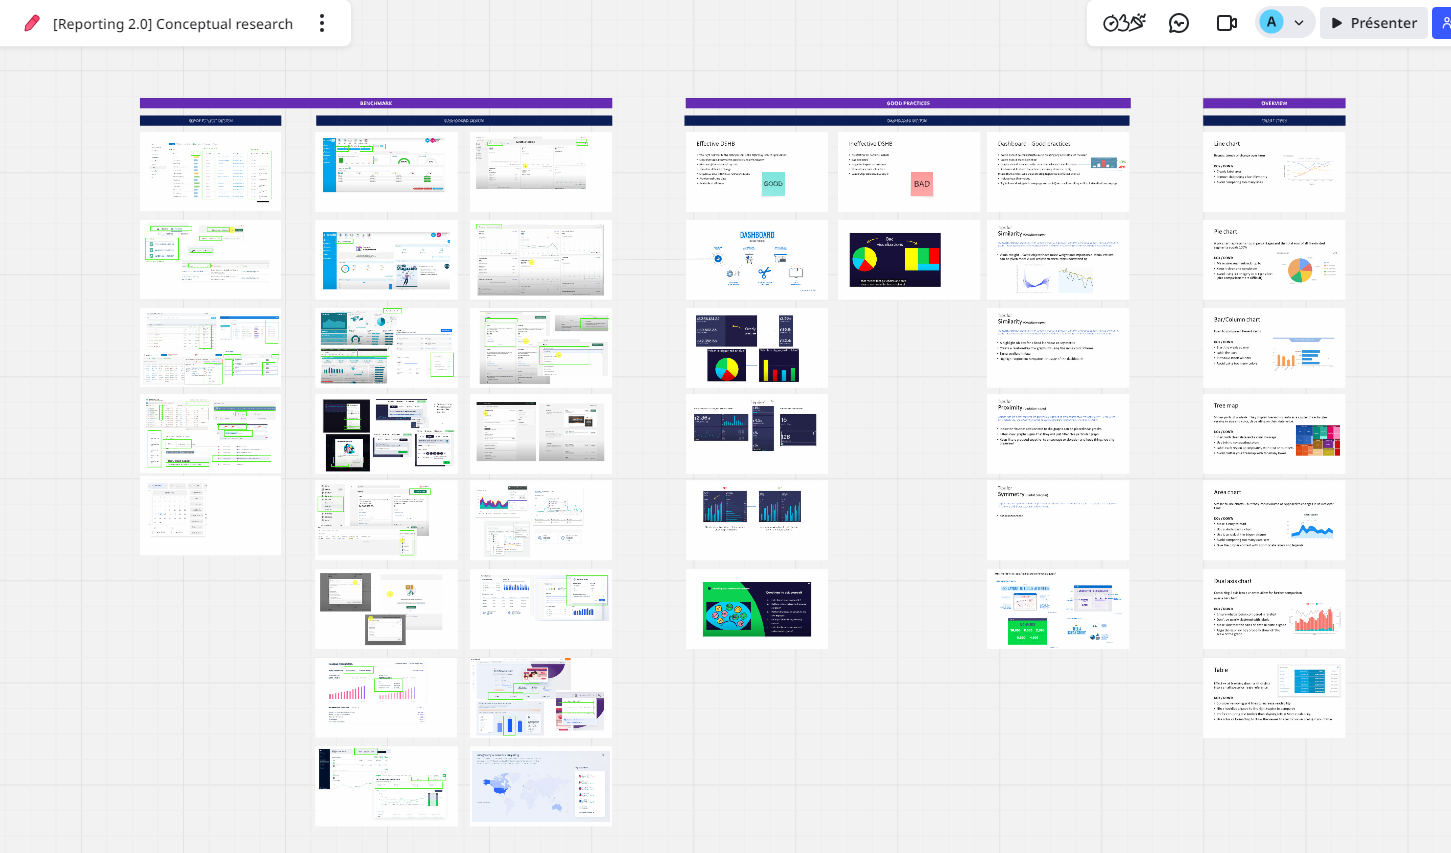
Conceptual research (benchmark)
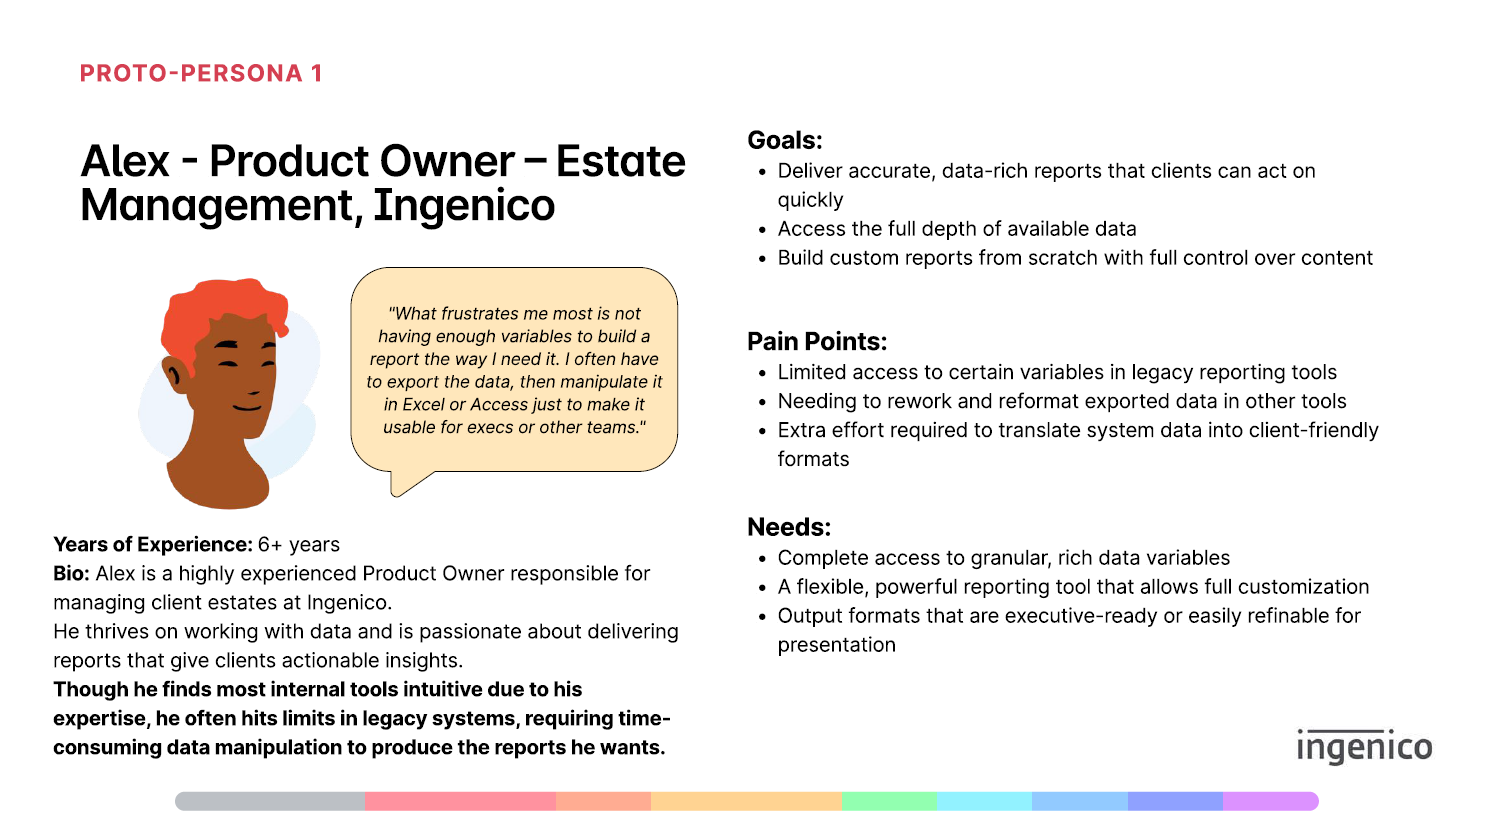
Proto persona
Ideation workshop
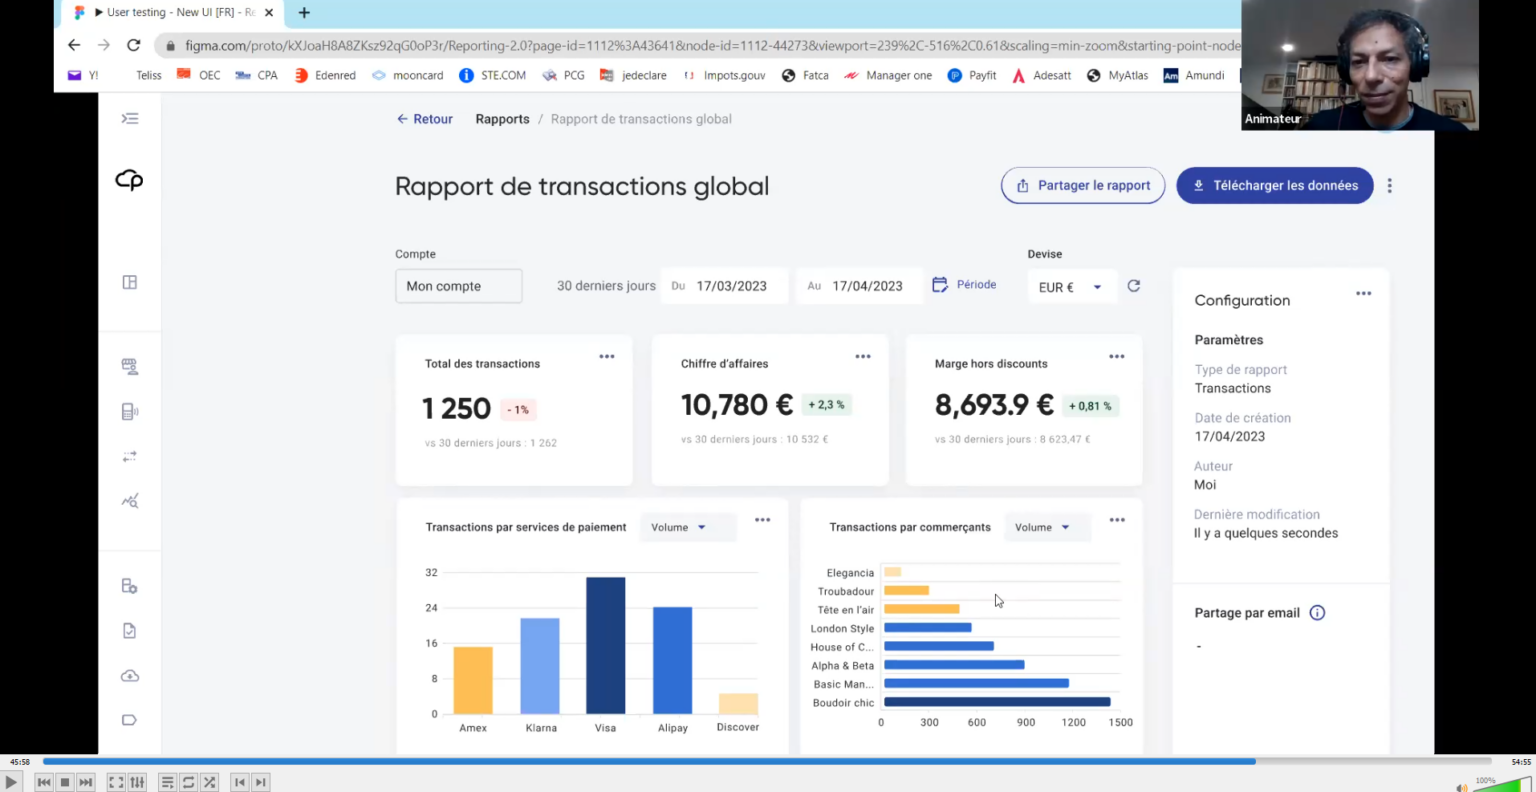
User testing
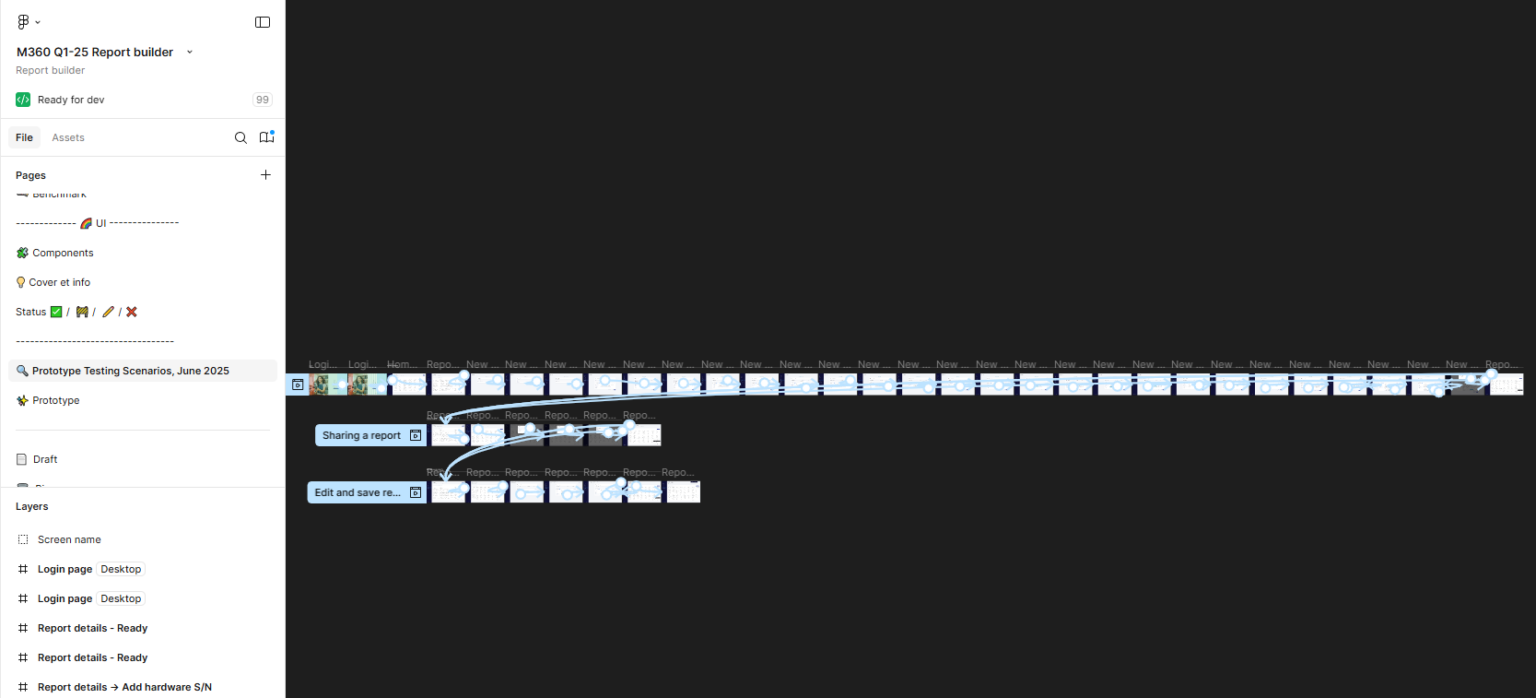
Prototyping
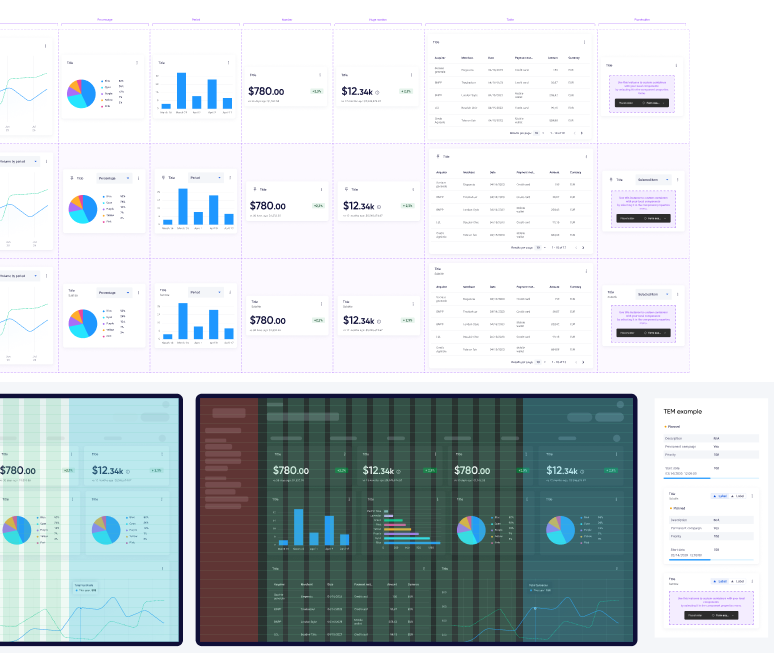
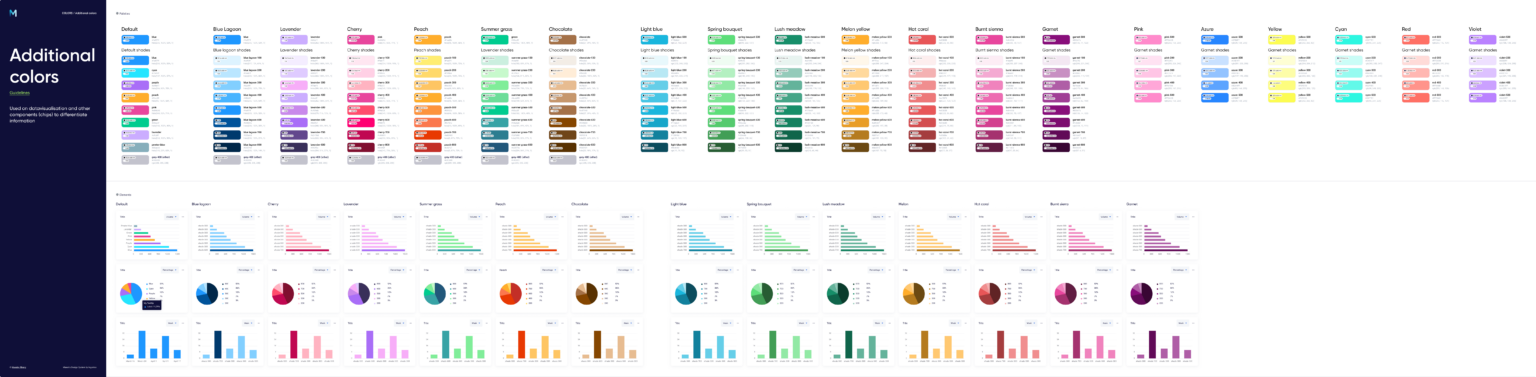
Design system additional (chart) colors
Unique features
Outcomes
Design work
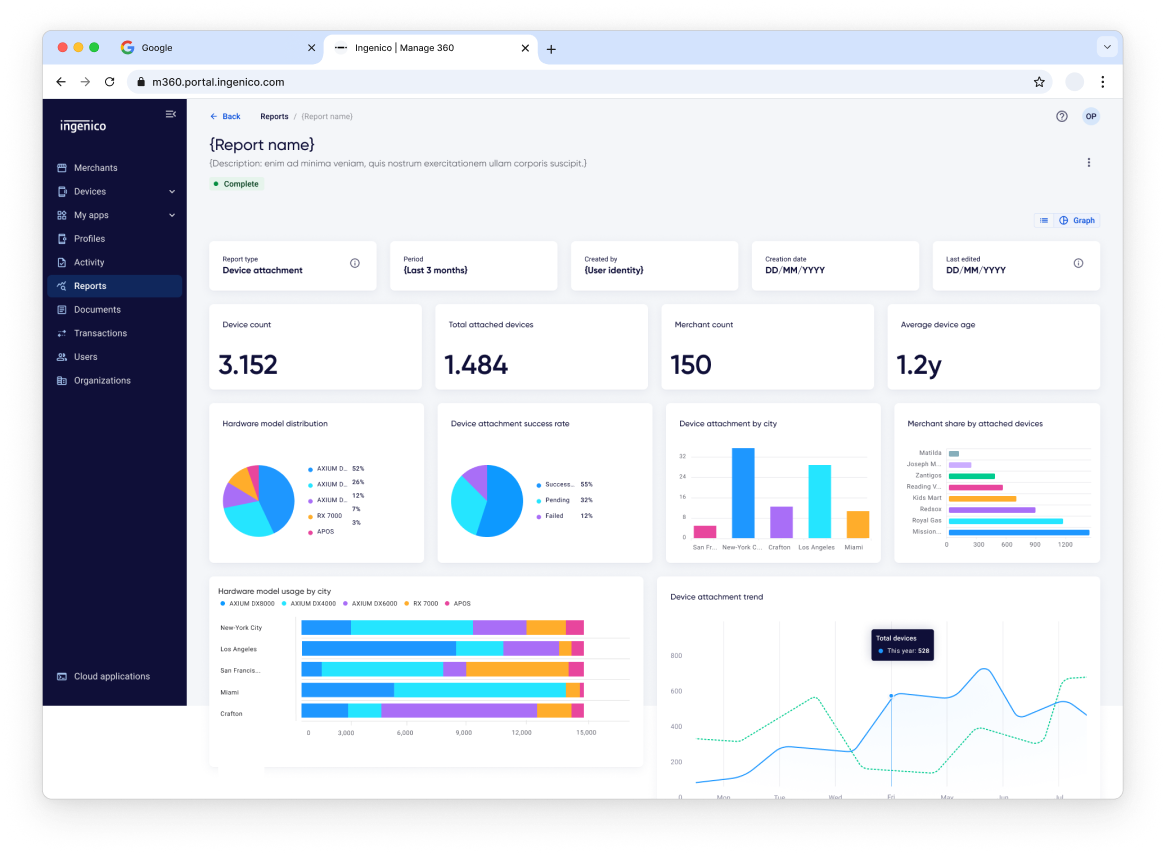
View custom report details
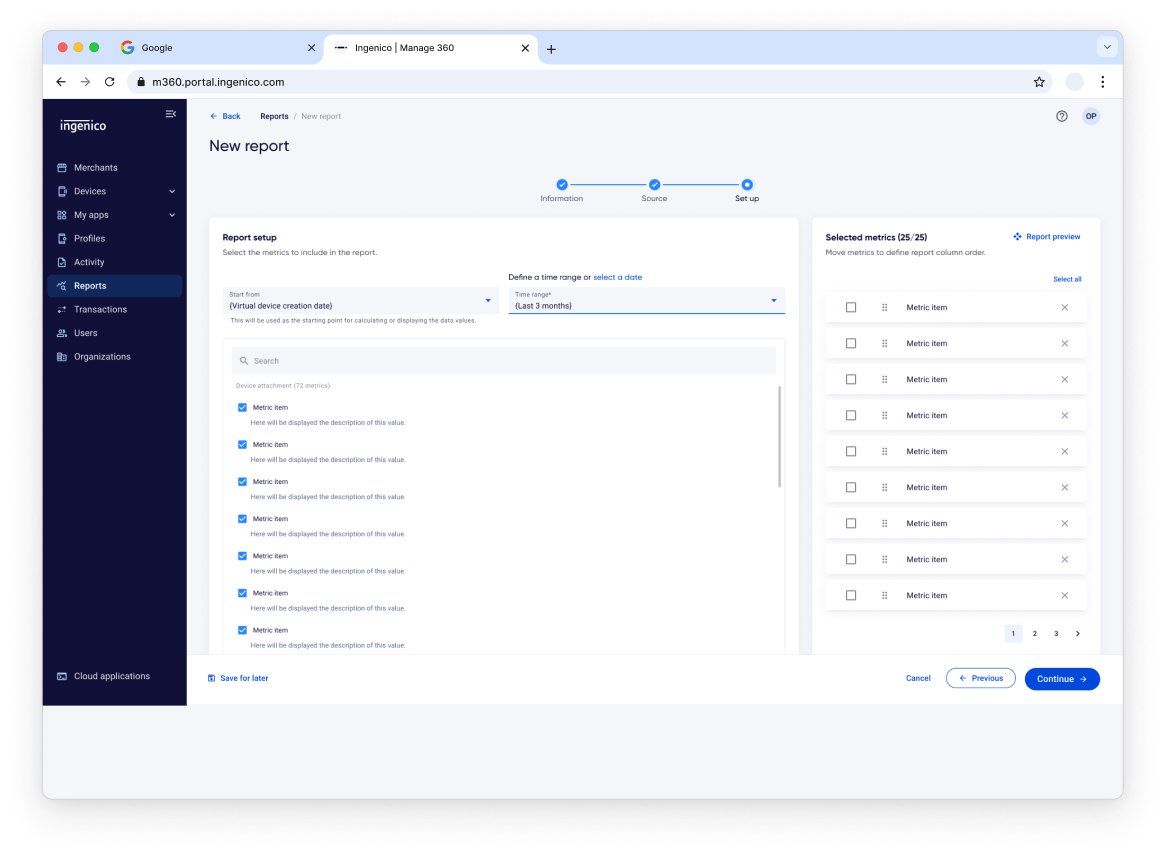
Create custom report flow
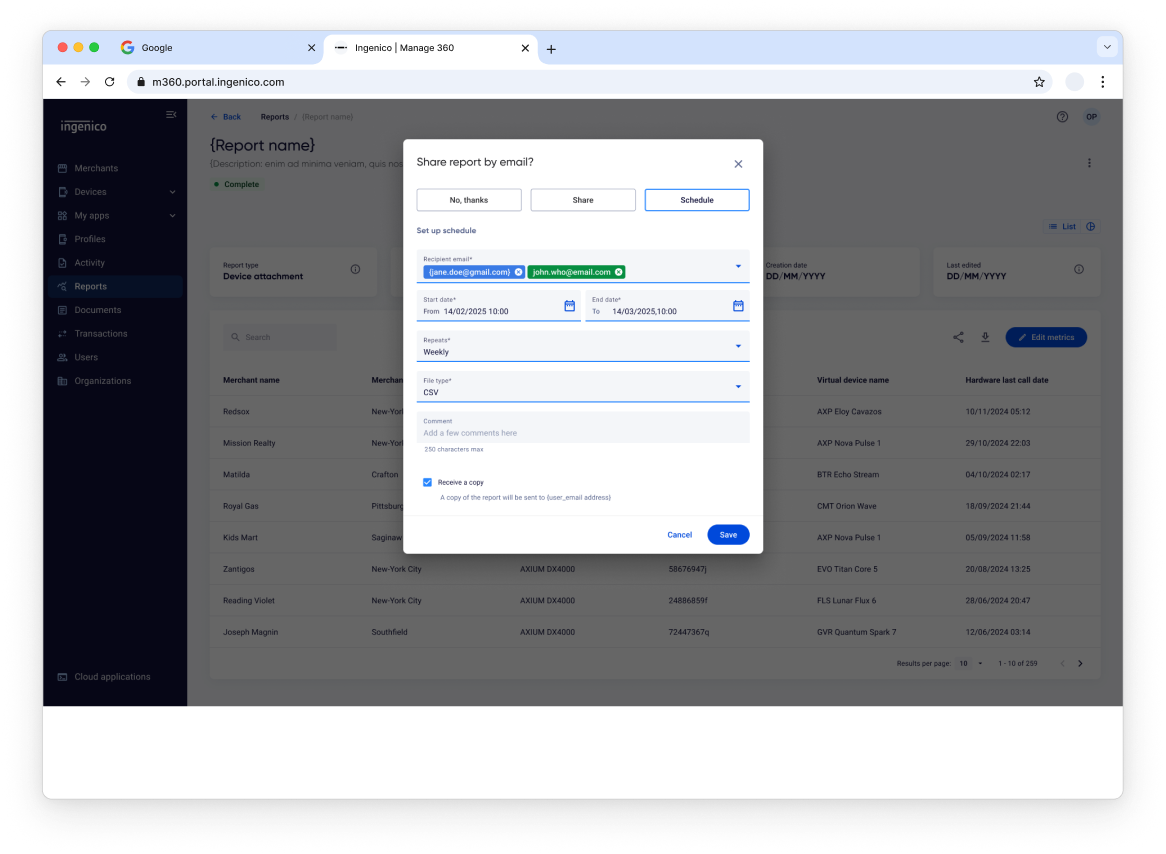
Share/Schedule report flow
Arielle NTSONDE | UX Designer & Product Writer | Paris (FR) or Remote EMEA